Outline
This test was conducted on Azure Database for Postgres Flexible Server with replication in place to see how fast replication works under load.
It will spawn 100 threads that will in parallel run 1000 insert statements.
Test Setup
This test uses the Apache JMeter load test tool to measure performance. Download JMeter from https://jmeter.apache.org/download_jmeter.cgi. You will need the PostgreSQL JDBC driver which can be downloaded from https://jdbc.postgresql.org/download/
Install JMeter
Extract the JMeter tgz archive to a folder of your choice.
Add the PostgreSQL driver to the JMeter lib/ subfolder.
Start JMeter by executing the script file associated with your platform.
Configure JMeter
Start by naming your empty test plan.
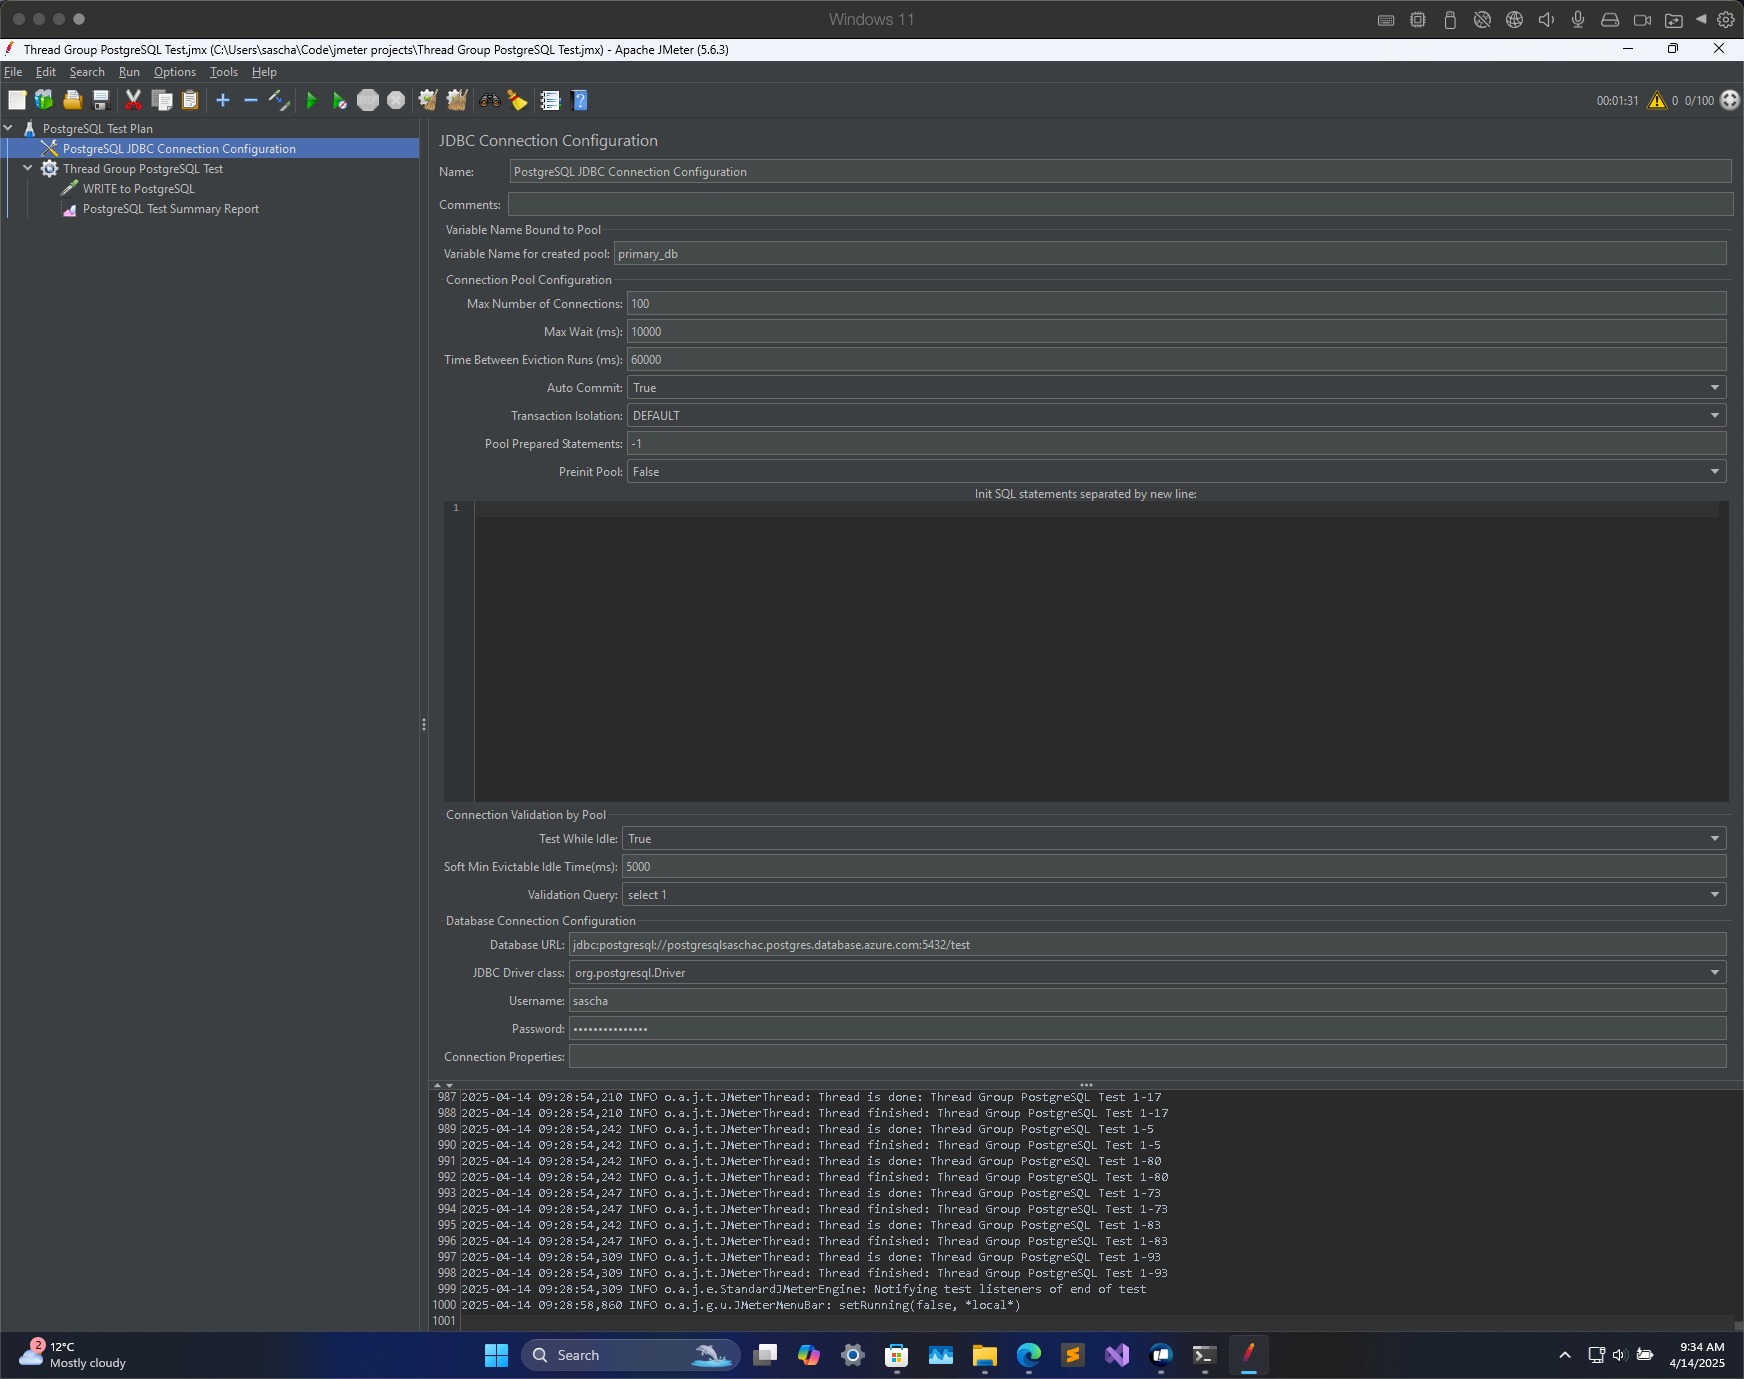
Next, add a JDBC Connection Configuration to the test plan. Give it a name and and set the variable name for created pool. Next, configure the Max Number of Connections, Max Visits (ms) and the Time Between Eviction Runs (ms).
Provide the Database URL in the format of jdbc:postgresql://servername.postgres.database.azure.com:5432/databasename
Specify the username and password as well as the JDBC Driver Class: org.postgresql.Driver which should be selectable from the drop-down box if the JDBC driver is present in the lib/ folder for JMeter.
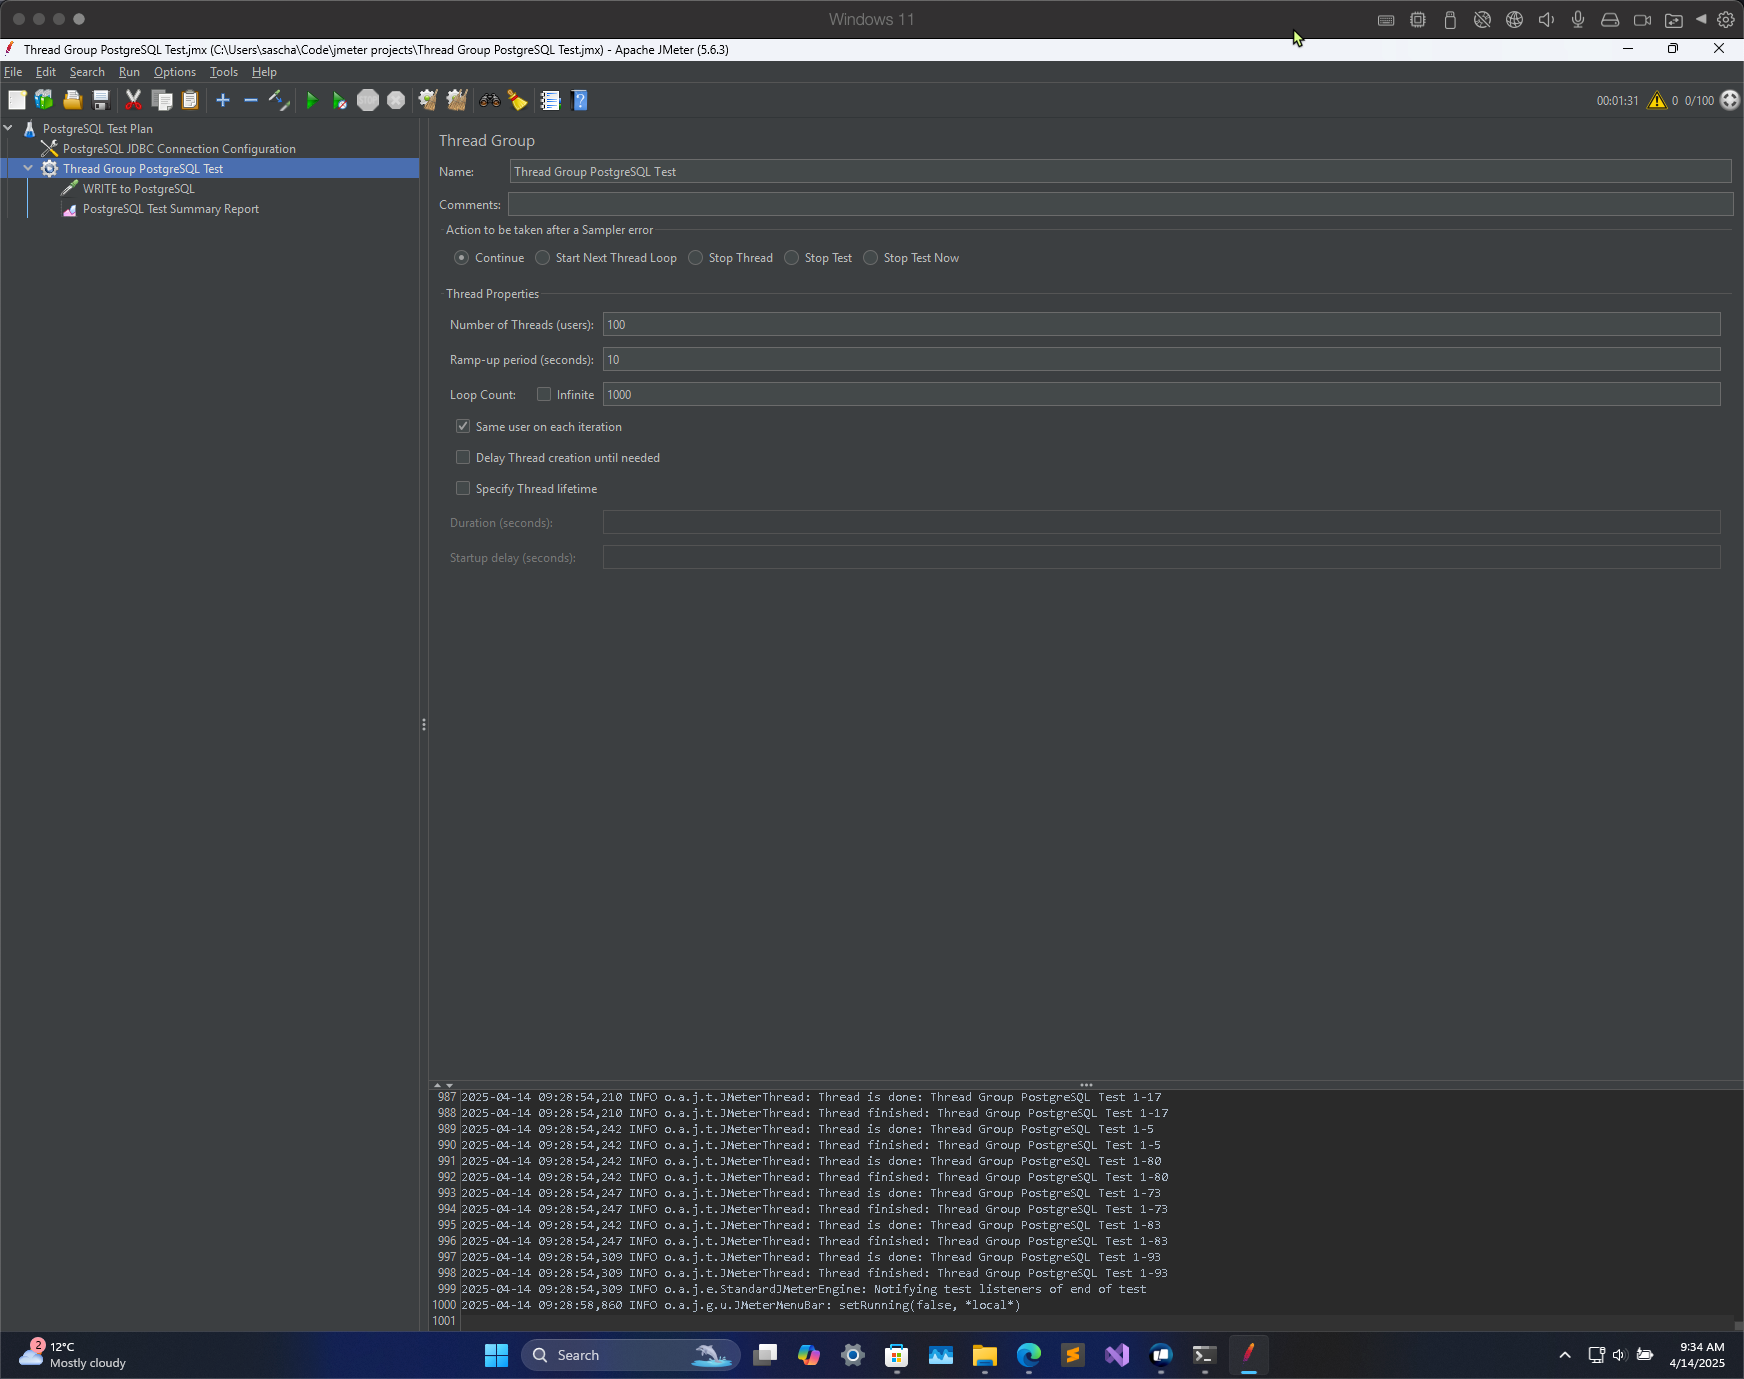
Now create a Thread Group and specify the Number of Threads (users), Ramp-Up Period (ms) and Loop Count.
Next, add a JDBC Request in which you specify the Variable Name of Pool declared in JDBC Connection Configuration. This is the value you set in the JDBC Connection Configuration.
Set the Query Type to Update Statement and add the query to insert data into the table. In case of the sample app linked above, this is:
INSERT INTO products (id, name, category, price, in_stock, created_at)
VALUES ('${__UUID()}', 'test', 'test', 100.0, 'true', '${__RandomDate(,,2050-07-08,,)}');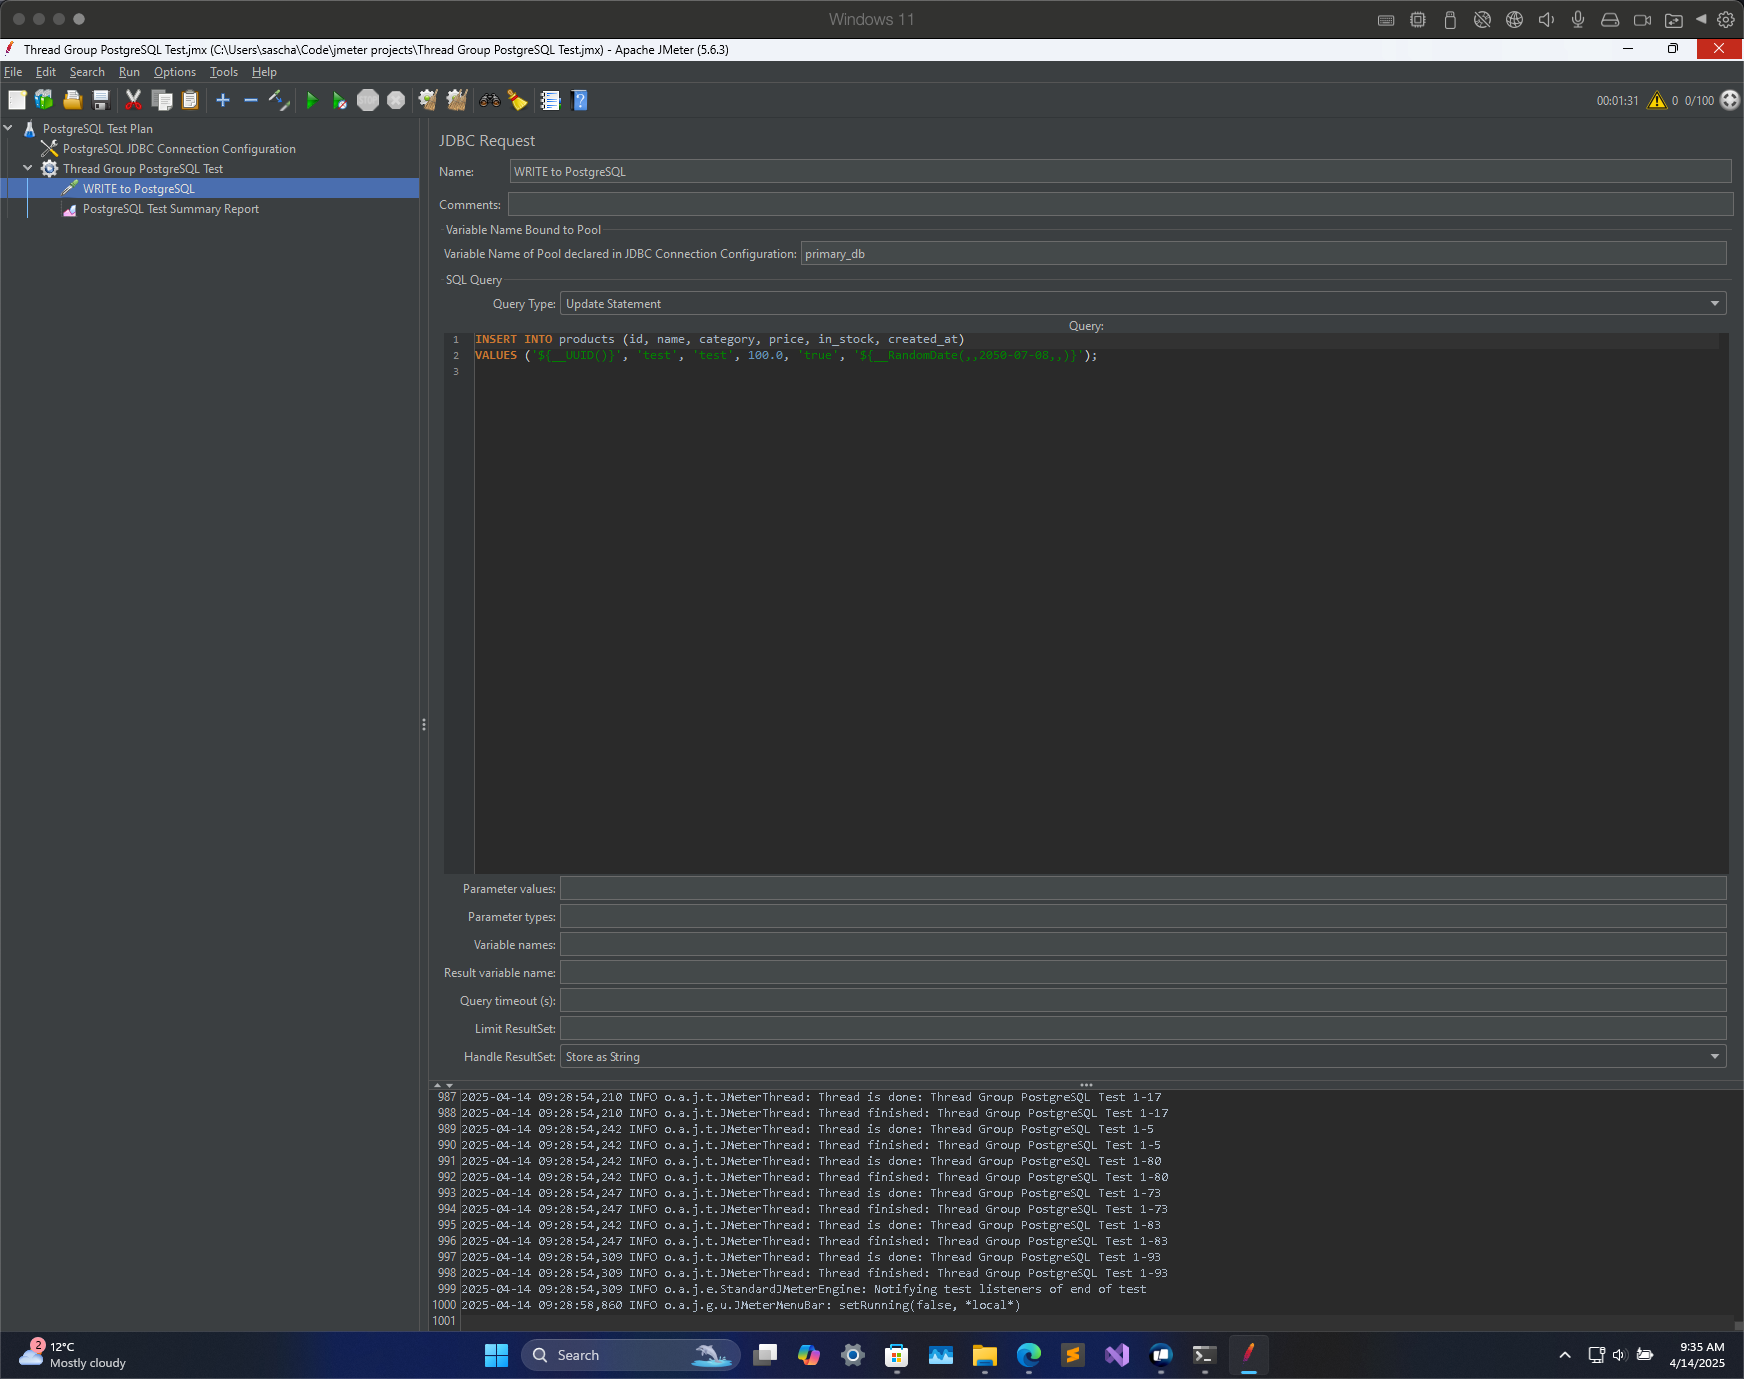
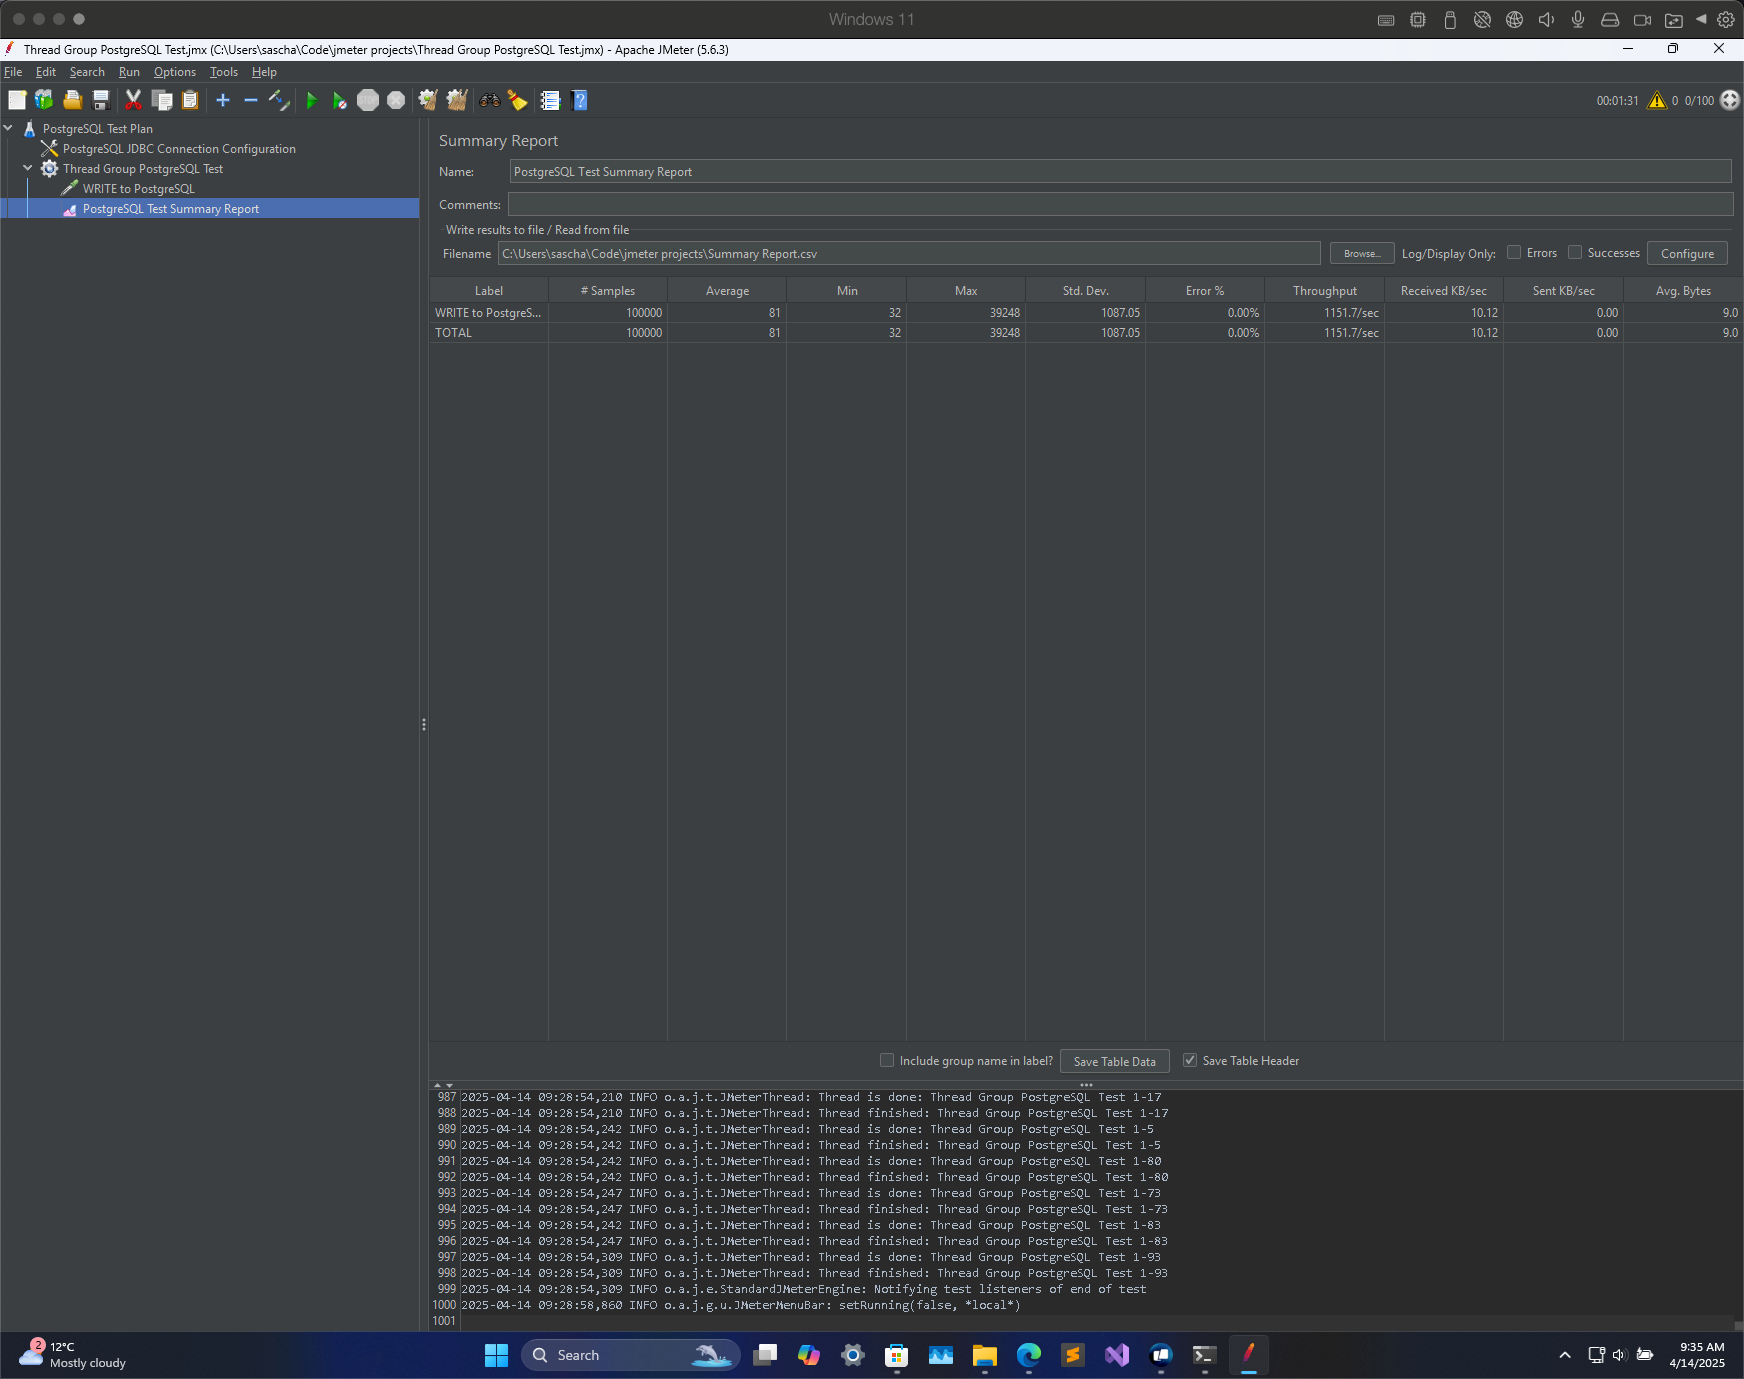
Finally, add a Summary Report and link it to a .csv file on your disk so output gets saved.
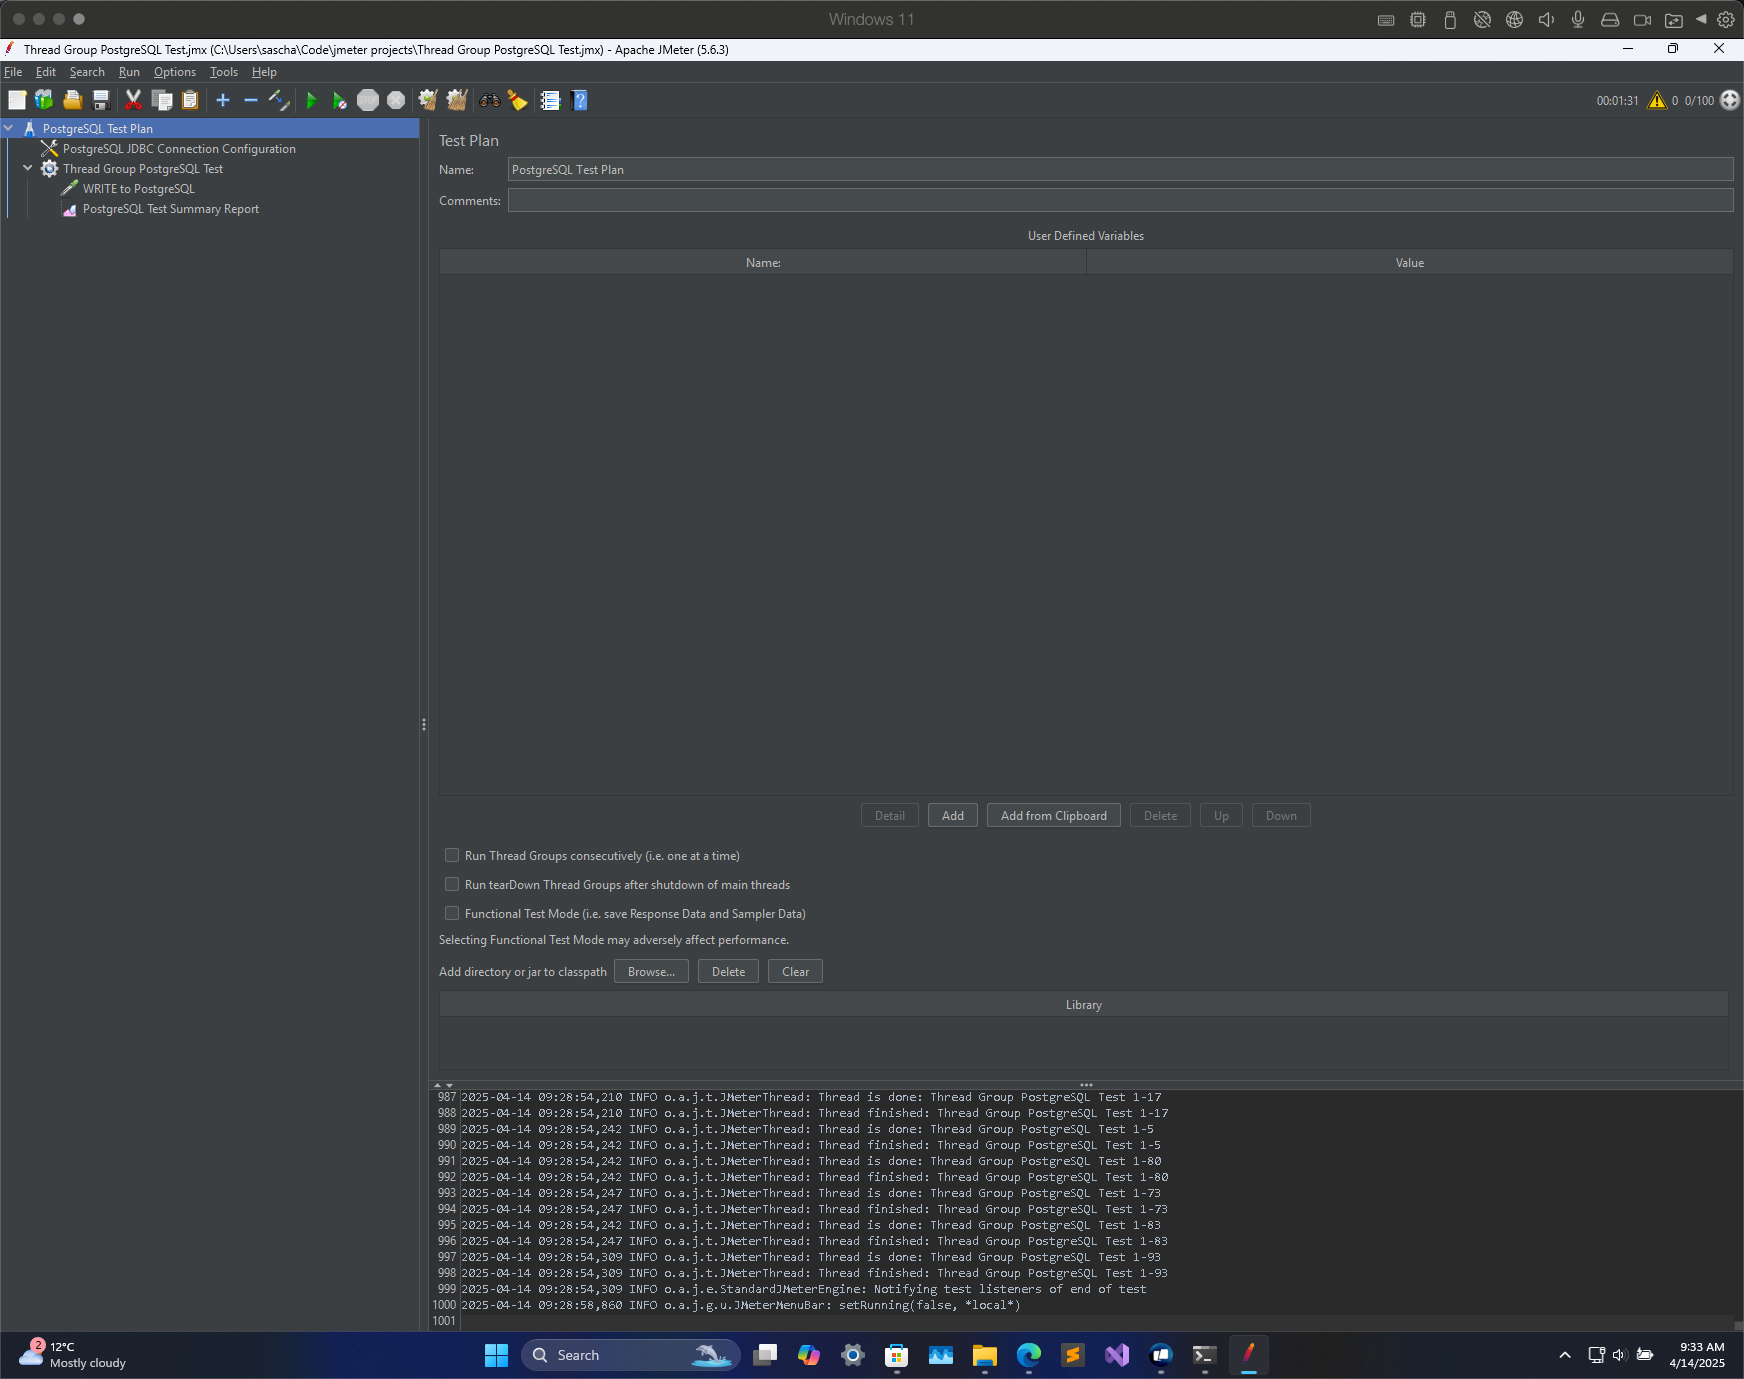
Start the test with the green ▶️ button in the toolbar and wait for it to finish.
The output window should show the following initialization:
2025-04-14 09:27:27,214 INFO o.a.j.e.StandardJMeterEngine: Running the test!
2025-04-14 09:27:27,215 INFO o.a.j.s.SampleEvent: List of sample_variables: []
2025-04-14 09:27:27,227 INFO o.a.j.g.u.JMeterMenuBar: setRunning(true, *local*)
2025-04-14 09:27:27,485 INFO o.a.j.e.StandardJMeterEngine: Starting ThreadGroup: 1 : Thread Group PostgreSQL Test
2025-04-14 09:27:27,485 INFO o.a.j.e.StandardJMeterEngine: Starting 100 threads for group Thread Group PostgreSQL Test.
2025-04-14 09:27:27,485 INFO o.a.j.e.StandardJMeterEngine: Thread will continue on error
2025-04-14 09:27:27,485 INFO o.a.j.t.ThreadGroup: Starting thread group... number=1 threads=100 ramp-up=10 delayedStart=false
2025-04-14 09:27:27,485 INFO o.a.j.t.JMeterThread: Thread started: Thread Group PostgreSQL Test 1-1
2025-04-14 09:27:27,495 INFO o.a.j.t.ThreadGroup: Started thread group number 1
2025-04-14 09:27:27,495 INFO o.a.j.e.StandardJMeterEngine: All thread groups have been started
2025-04-14 09:27:27,600 INFO o.a.j.t.JMeterThread: Thread started: Thread Group PostgreSQL Test 1-2
... repeat for each worker ...
2025-04-14 09:28:53,791 INFO o.a.j.t.JMeterThread: Thread is done: Thread Group PostgreSQL Test 1-1
2025-04-14 09:28:53,791 INFO o.a.j.t.JMeterThread: Thread finished: Thread Group PostgreSQL Test 1-2
... repeat for each worker ...
2025-04-14 09:28:54,309 INFO o.a.j.e.StandardJMeterEngine: Notifying test listeners of end of test
2025-04-14 09:28:58,860 INFO o.a.j.g.u.JMeterMenuBar: setRunning(false, *local*)
The Summary Report should show you the performance of the test:
Label,# Samples,Average,Min,Max,Std. Dev.,Error %,Throughput,Received KB/sec,Sent KB/sec,Avg. Bytes
WRITE to PostgreSQL,100000,81,32,39248,1087.05,0.002%,1151.70222,10.12,0.00,9.0
TOTAL,100000,81,32,39248,1087.05,0.002%,1151.70222,10.12,0.00,9.0
Detailed performance output for each individual insert statement can be found in the CSV file you specified in the Summary Report step.
Replication Lag
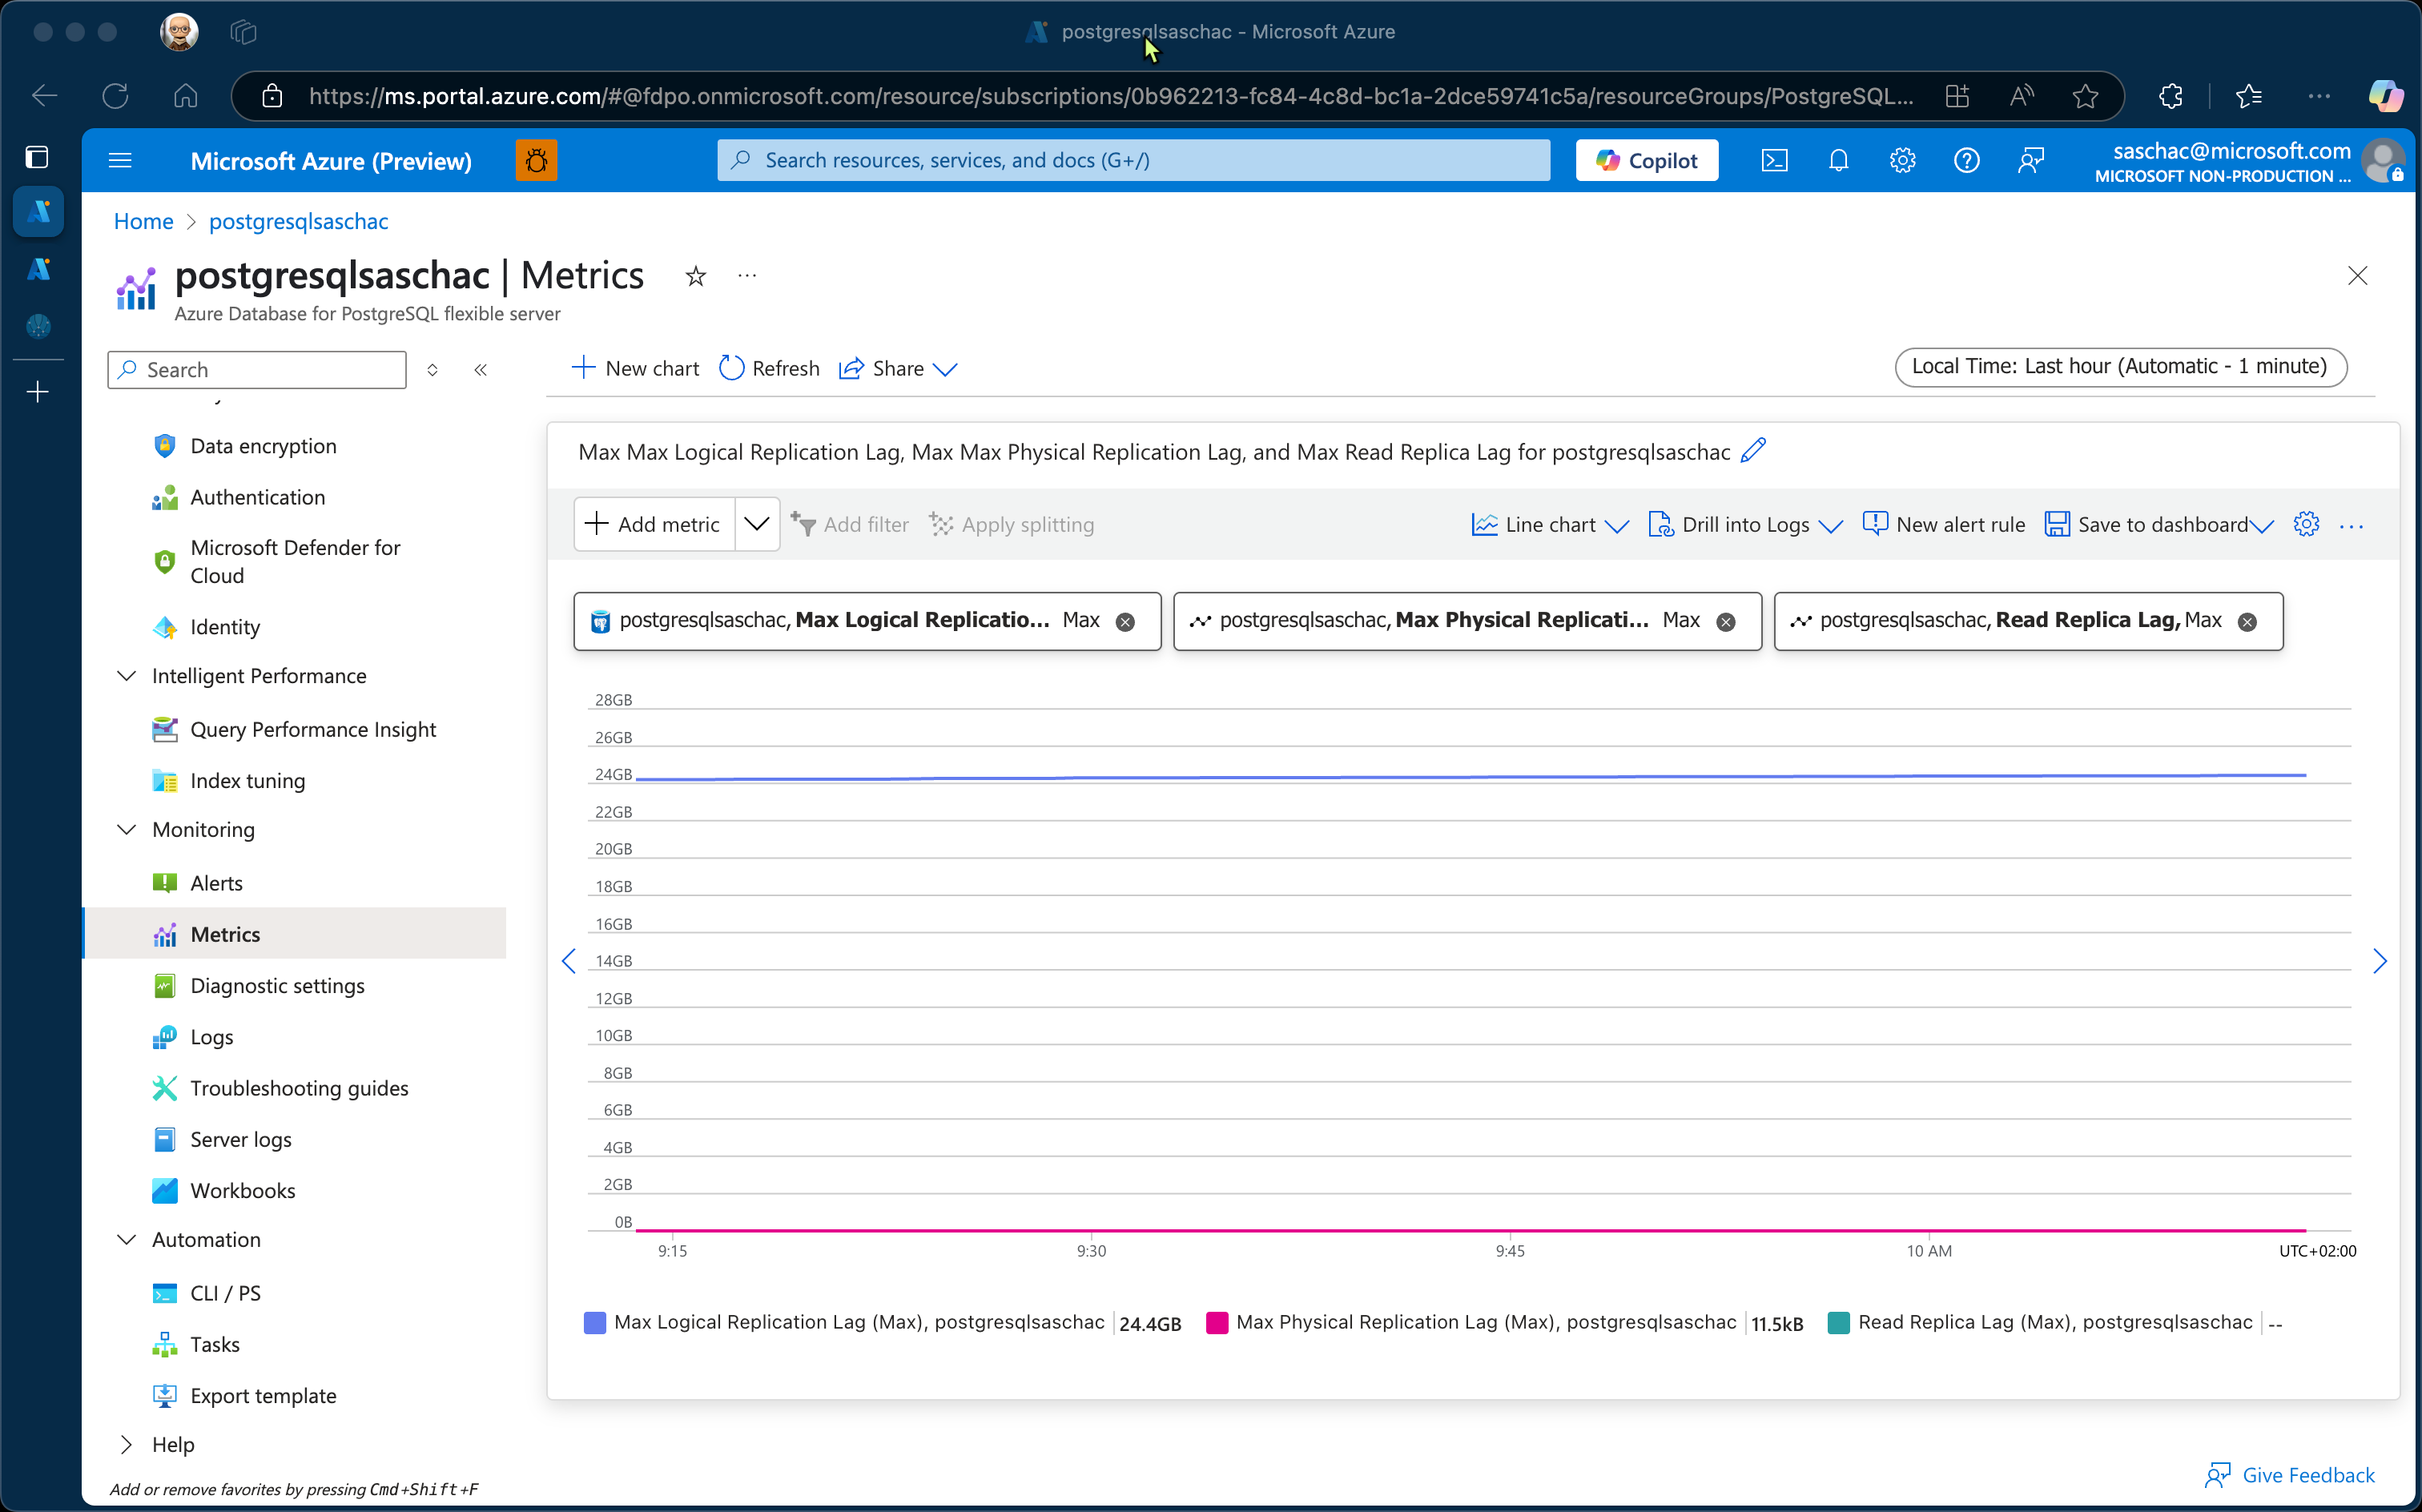
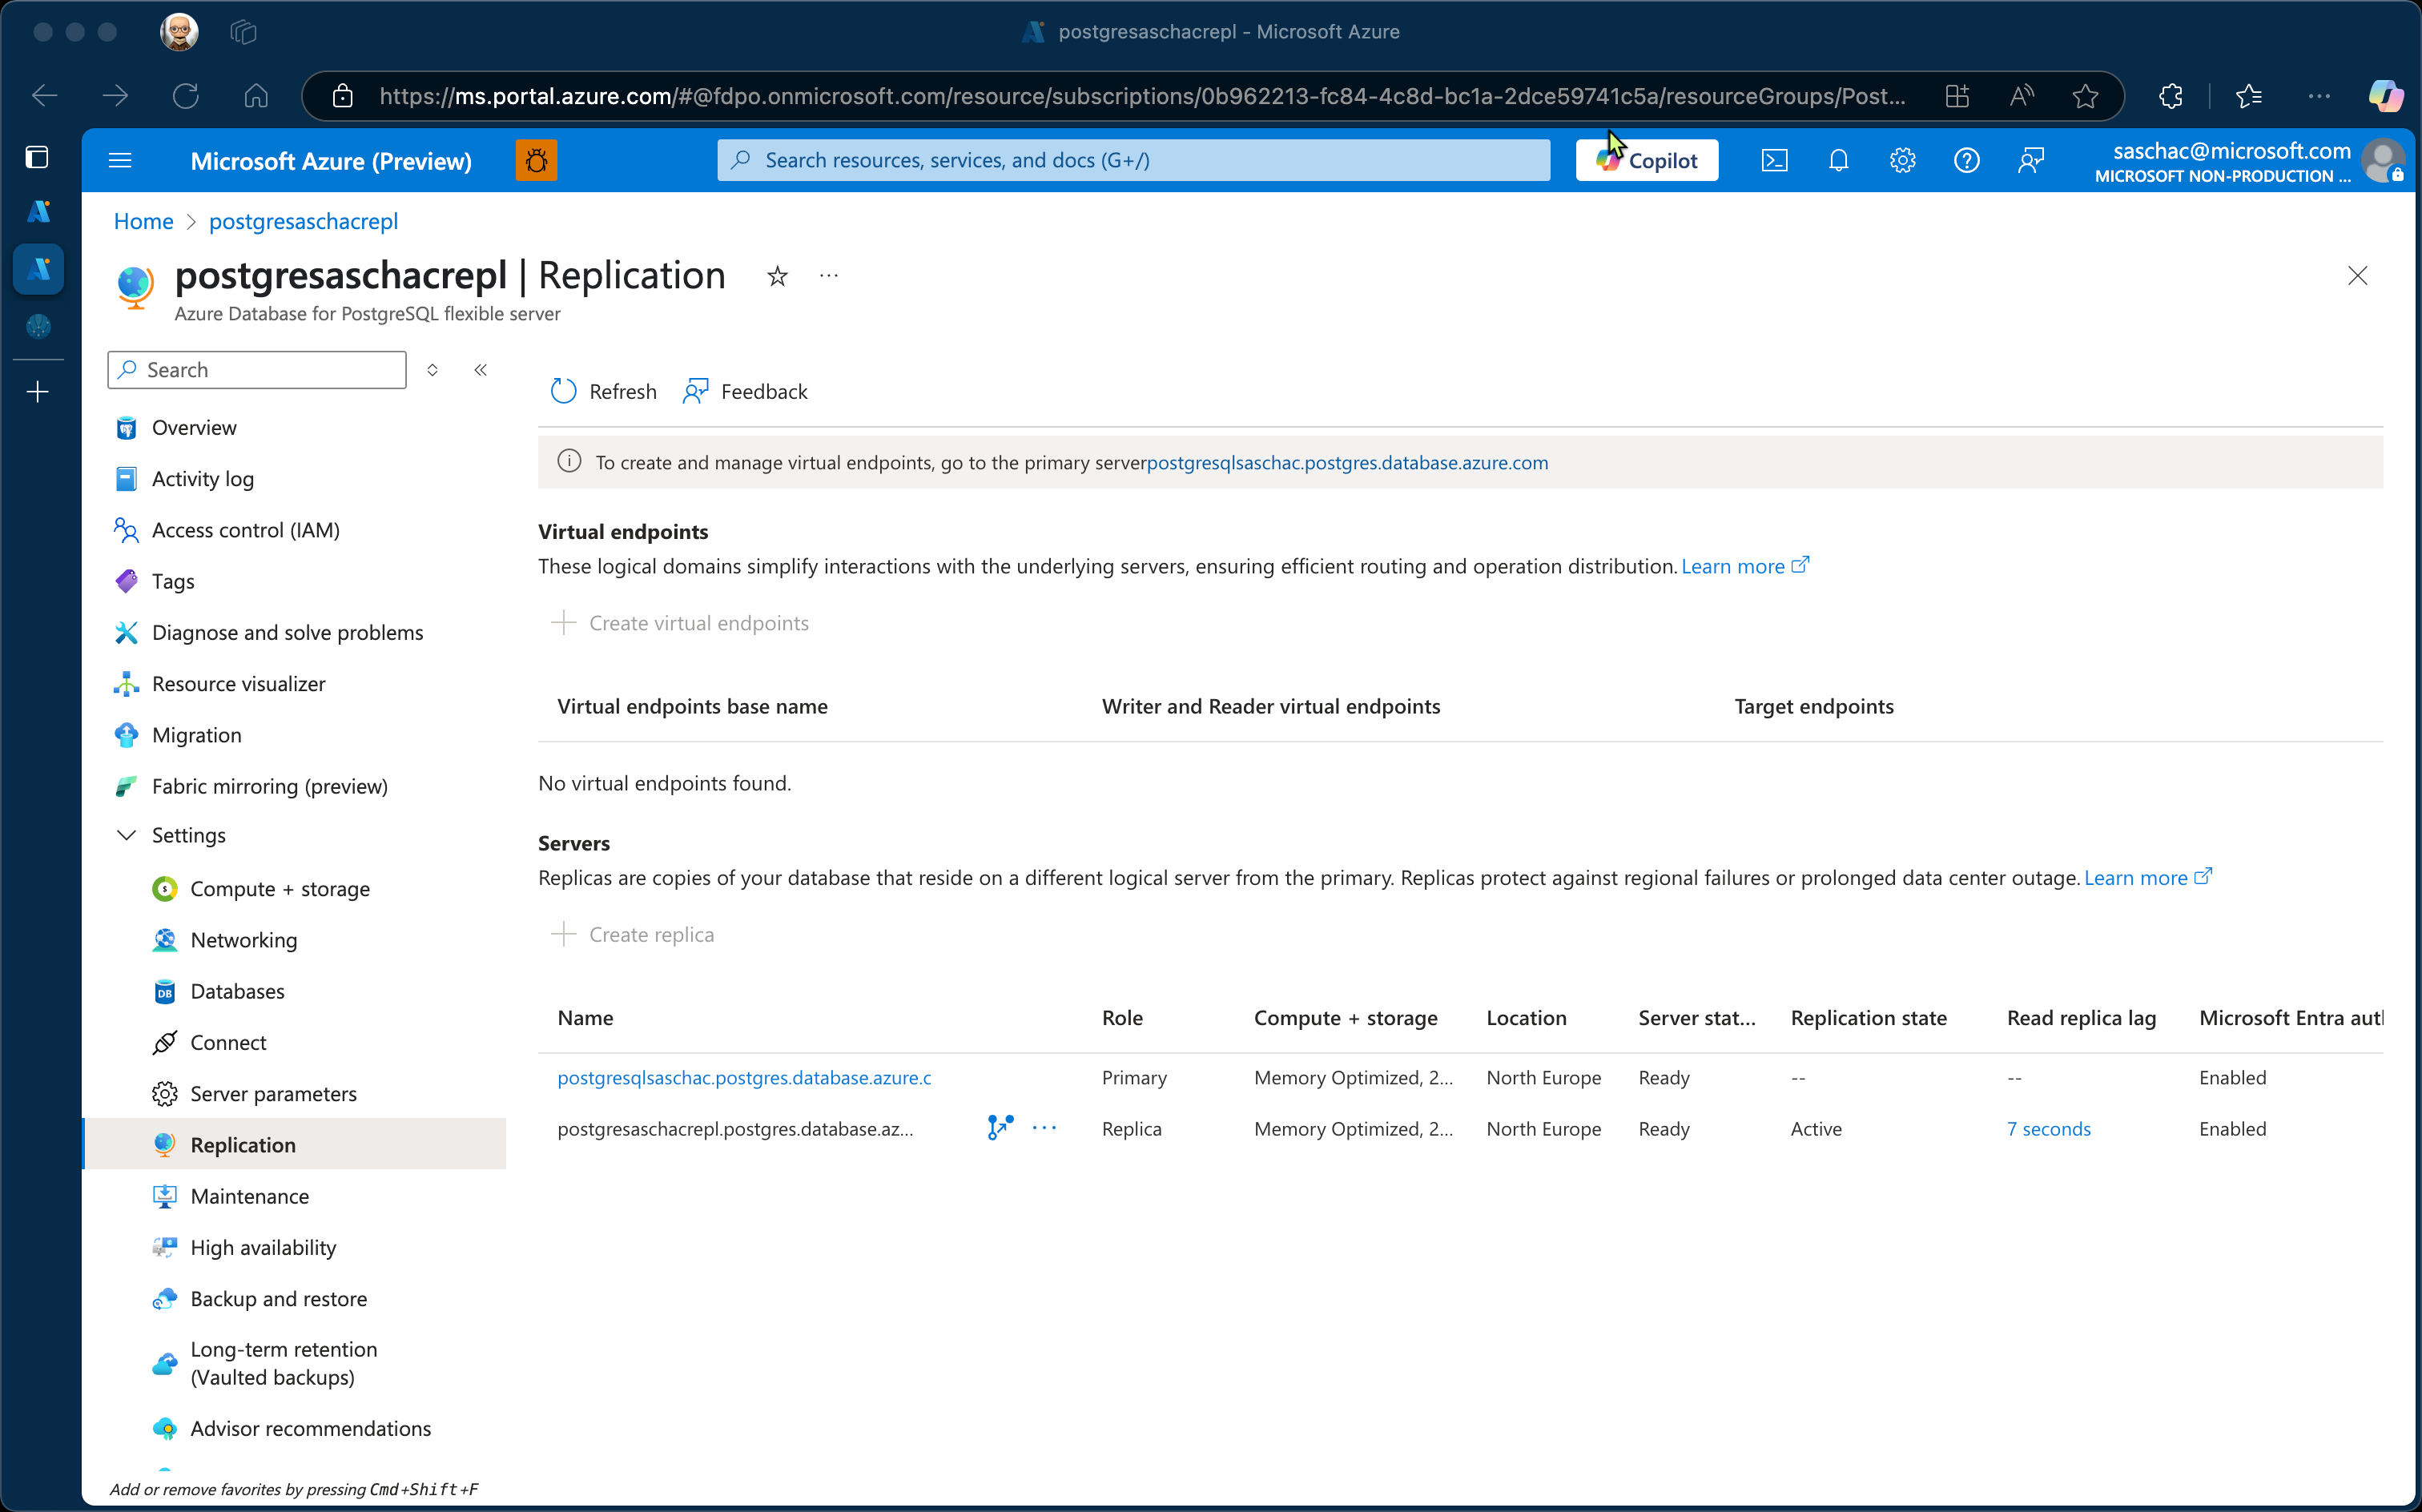
If you are using Azure Database for PostgreSQL Flexible Server, you can see the replication lag over time by selecting the replica and clicking on the Read Replica Log column.
In this case, the maximum lag was 7 seconds.
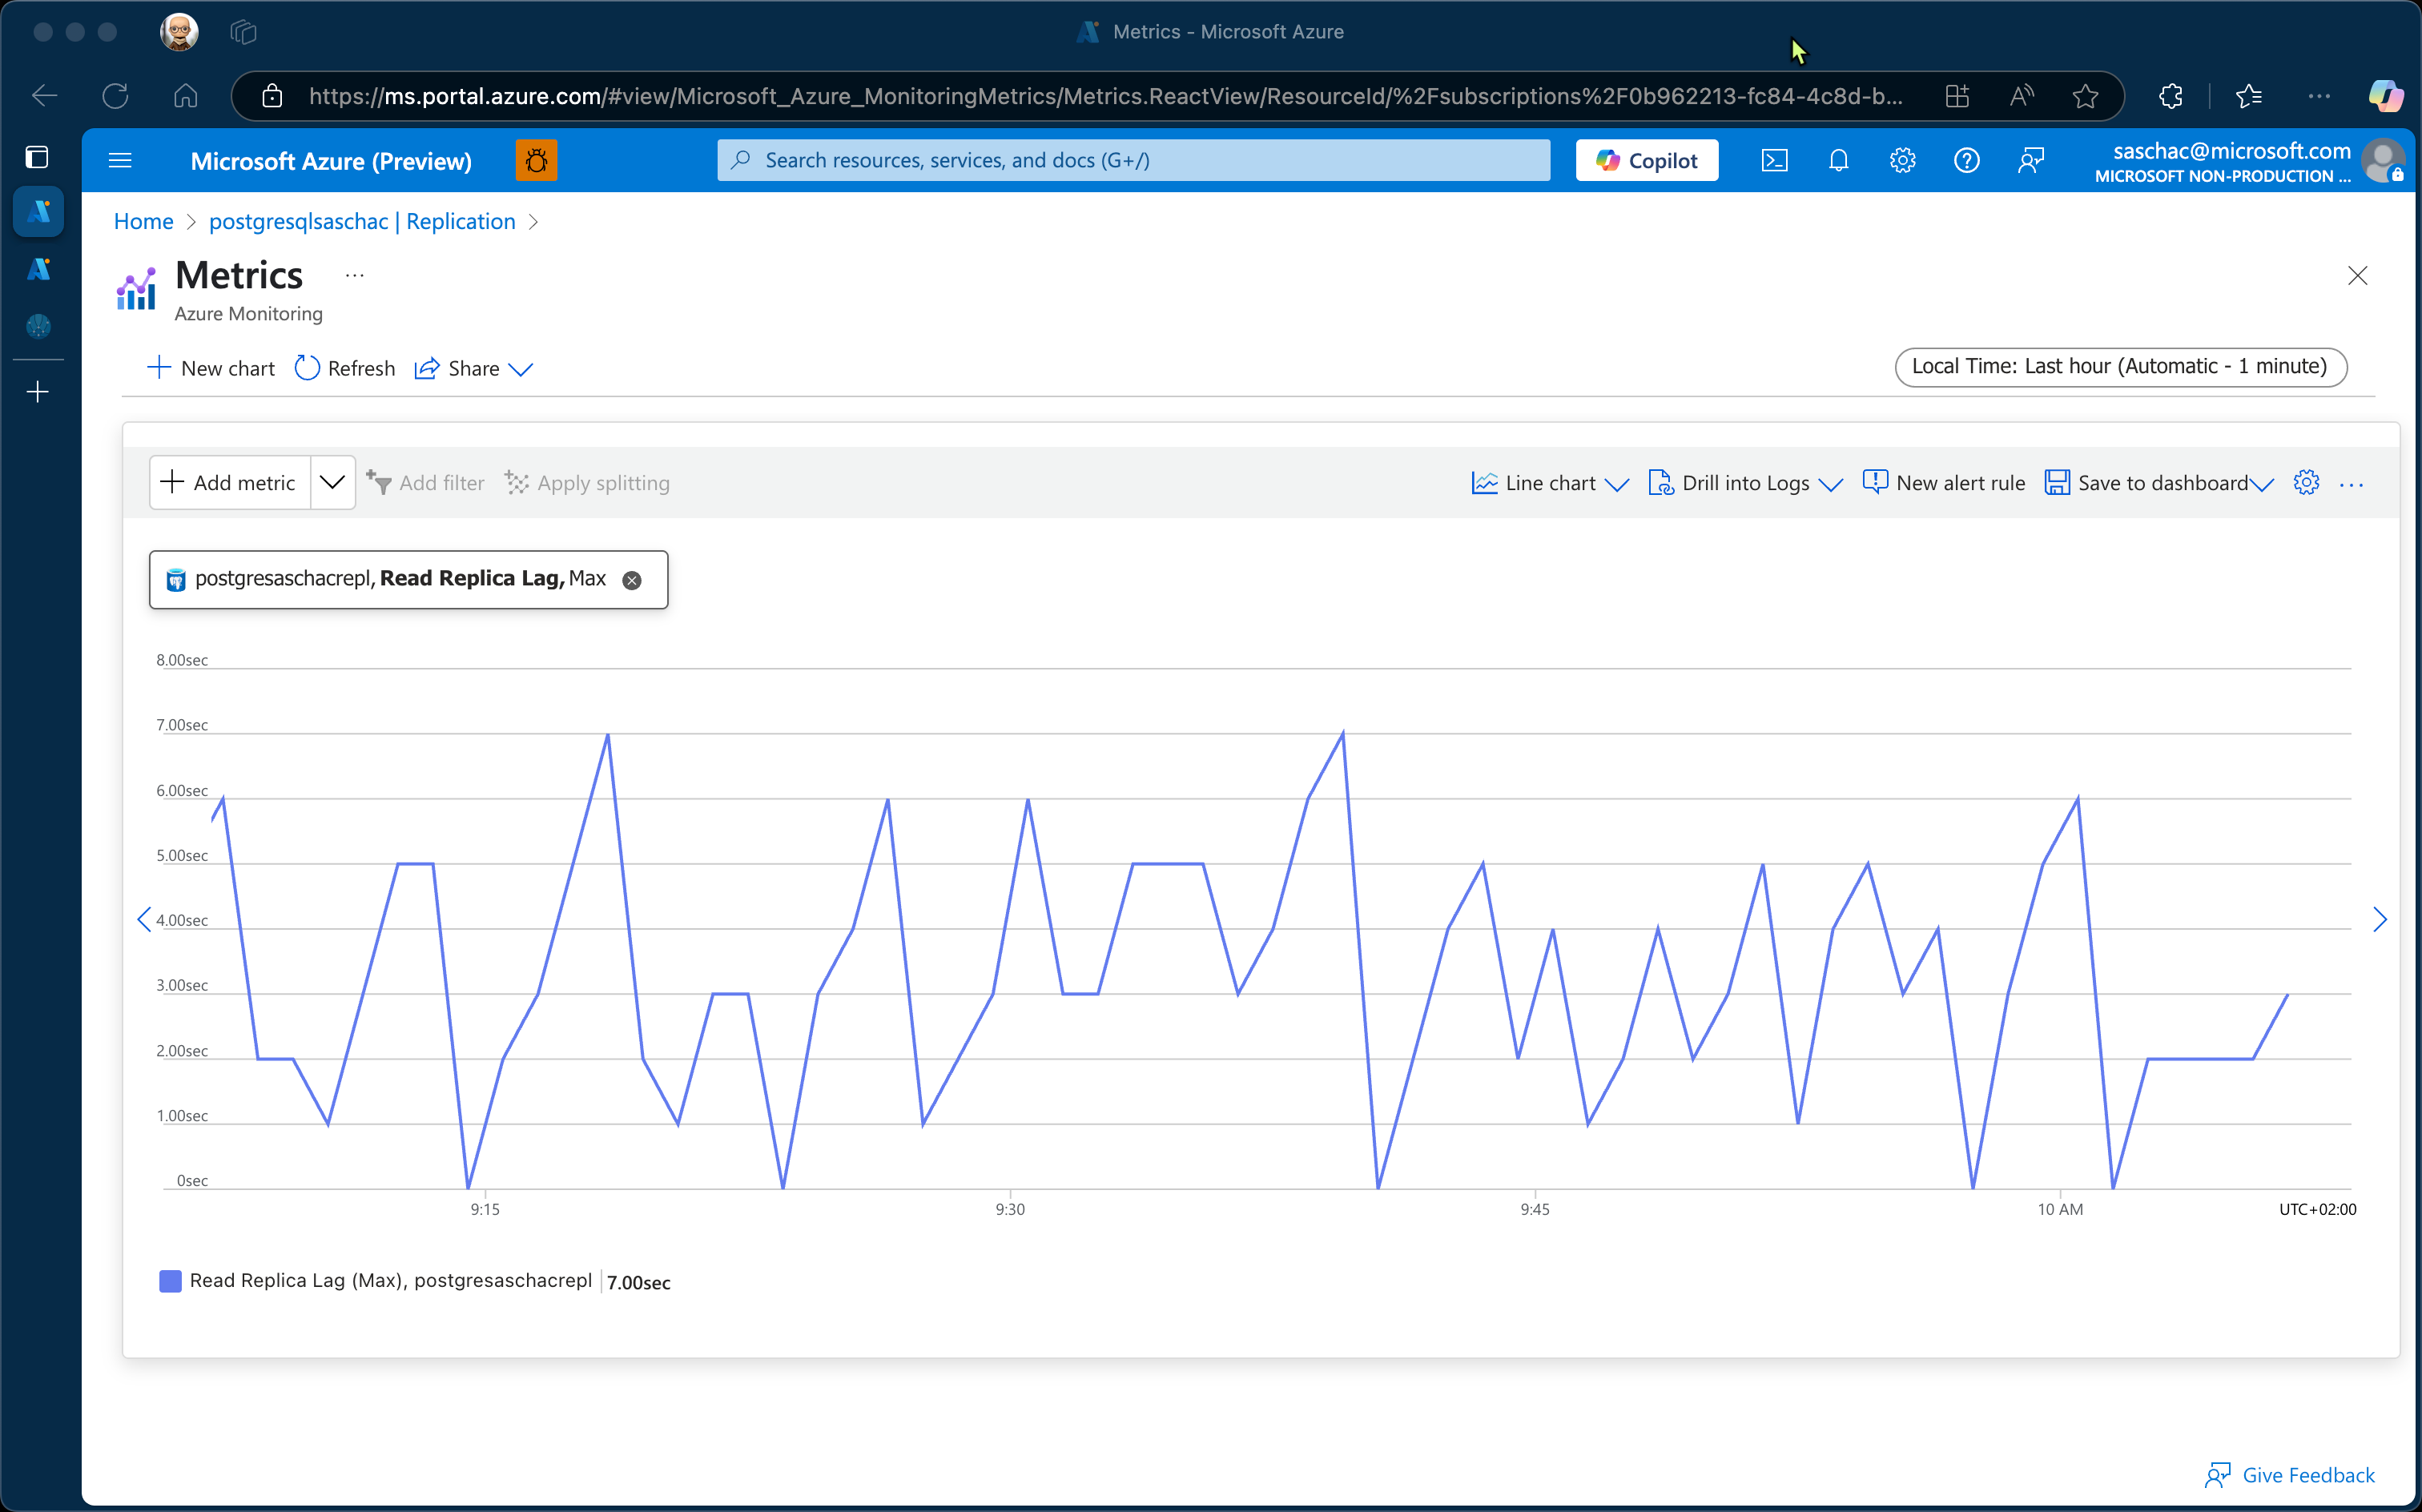
Other metrics available uner Metrics are Max Logical Replication Lag, Max Physical Replication Lag and Read Replica Lag.